Image area selection by intensity (code included)
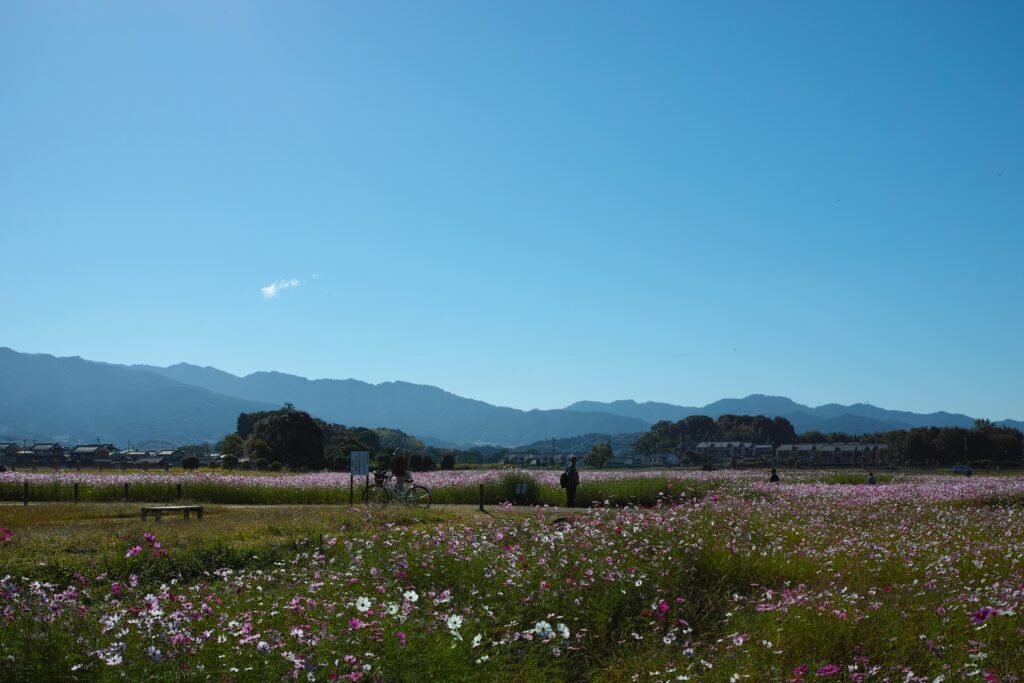
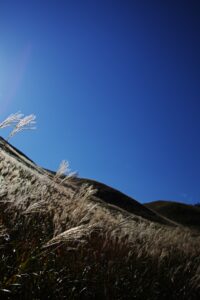
I went Fujiwara Palace ruins the other day as I heard a large cosmos flower field appears during autumn. I could take nice photos of cosmos flowers, and thought I'd try to make it into a watercolor painting like the following free material, by computing.
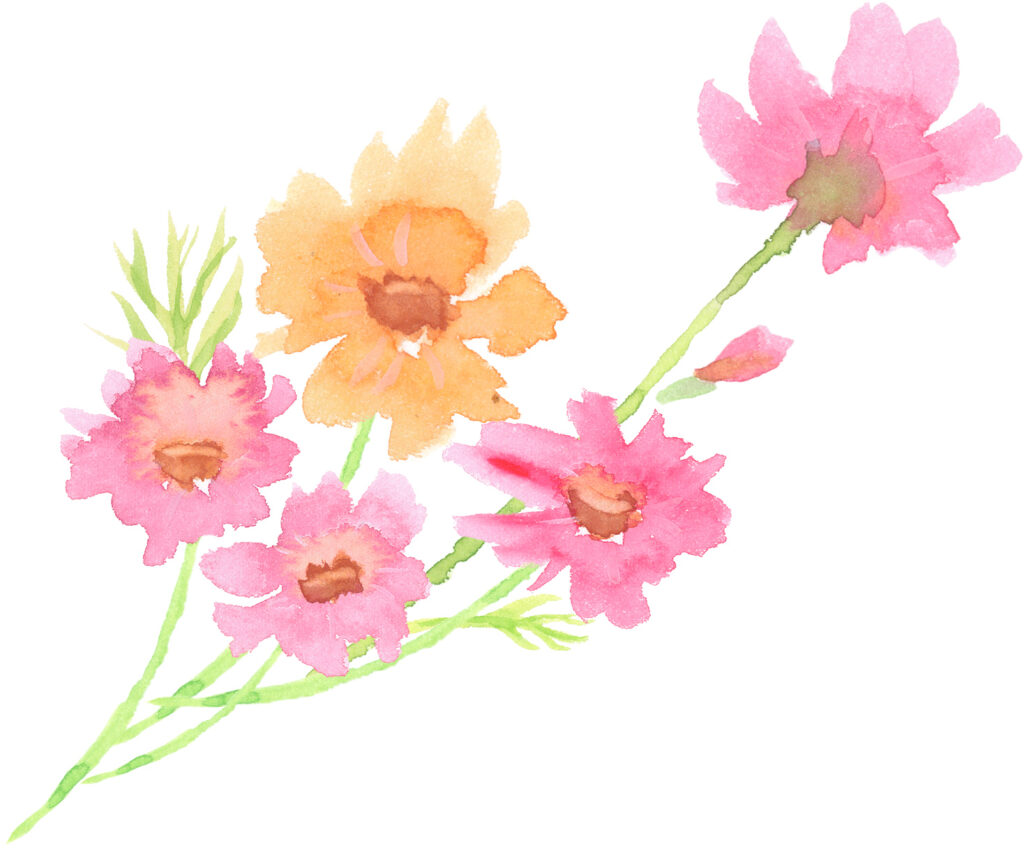
Target: watercolor painting of cosmos flowers (the picture below is a copyright free material)
Before applying Neural Style Transfer, however, I need to remove the busy background from the photo so that the only flowers, stems and leaves stand out: I would like to do the followings in short.
As a matter of fact, many background removal services for photos can be found online today, but when I tried some of them, their outputs were quite different from my expectation probably due to complex and blur background of the flower photos. So I decided to do this by myself.
I thought it would be better to use deep learning such as image segmentation firstly, but I wanted to do it more easily and intuitively. After playing around with RGB data on some photos, I came up with the idea of keeping only the desired image area using RGB intensity thresholds. As a result, it went reasonably well even with a very simple code. Here it is.
# import libraries
from PIL import Image
import numpy as np
import matplotlib.pyplot as plt
import seaborn as sns
%matplotlib inline
# load an sample image
img_origin = Image.open("sample_image.jpg")
img_0 = img_origin.copy() # use as original colors later
img_1 = img_origin.copy() # use as outline if selected images
img_2 = img_origin.copy() # use as intensity control
img_2_r = img_origin.copy() # use as red control
img_2_g = img_origin.copy() # use as green control
img_2_b = img_origin.copy() # use as blue control
width, height = img_0.size # get image shape
print('width, height = ', width, height)
print('tensor shape = ', np.array(img_0).shape)
# get RGB intensity in the image
for y in range(height):
for x in range(width):
r, g, b = img_2.getpixel((x, y))
img_2_r.putpixel((x, y), (r, g - 300, b - 300)) # red intensity
img_2_g.putpixel((x, y), (r - 300, g, b - 300)) # green intensity
img_2_b.putpixel((x, y), (r - 300, g -300, b)) # blue intensity
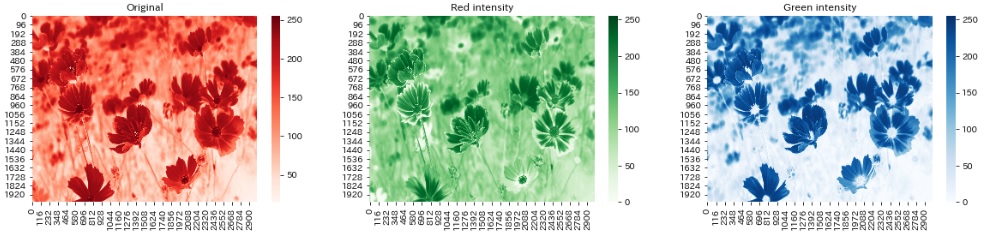
# visualize the original image and color intensity
fig = plt.figure(figsize = (20, 8))
ax1 = fig.add_subplot(1, 4, 1)
ax2 = fig.add_subplot(1, 4, 2)
ax3 = fig.add_subplot(1, 4, 3)
ax4 = fig.add_subplot(1, 4, 4)
ax1.imshow(img_0)
ax2.imshow(img_2_r)
ax3.imshow(img_2_g)
ax4.imshow(img_2_b)
ax1.set_title('Original')
ax2.set_title('Red intensity')
ax3.set_title('Green intensity')
ax4.set_title('Blue intensity')
plt.show()You can see this images.
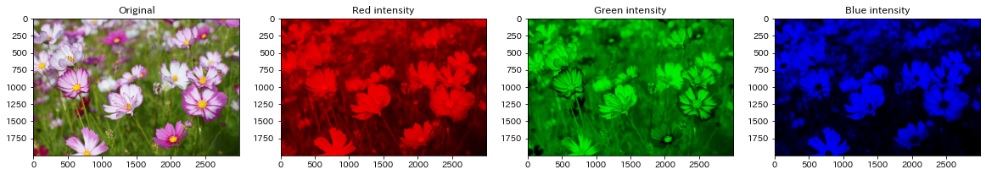
Now I want to extract only flowers and outstanding stems and leaves from the original photo. All color intensity seems usable for flowers, while red and green look enough to select stems and leaves. Then need to know the color intensity level to determine thresholds for area to be kept.
# visualize the intensity level (0-255) of each RGB color

fig = plt.figure(figsize = (20, 4))

ax1 = fig.add_subplot(1, 3, 1)
ax2 = fig.add_subplot(1, 3, 2)
ax3 = fig.add_subplot(1, 3, 3)

sns.heatmap(np.array(img_2_r)[:, :, 0], cmap = 'Reds', ax = ax1)
sns.heatmap(np.array(img_2_g)[:, :, 1], cmap = 'Greens', ax = ax2)
sns.heatmap(np.array(img_2_b)[:, :, 2], cmap = 'Blues', ax = ax3)

ax1.set_title('Original')
ax2.set_title('Red intensity')
ax3.set_title('Green intensity')

plt.show()
RGB intensity is like this.
In this case, intensity 200 for red, 120 for green, and 100 for blue would be good thresholds for images to be kept.
# change intensity lower in the area to be removed
for y in range(height):
for x in range(width):
r, g, b = img_1.getpixel((x, y))
img_1.putpixel((x, y), (r - 200, g - 120, b - 100)) # apply the thresholds for RGB!
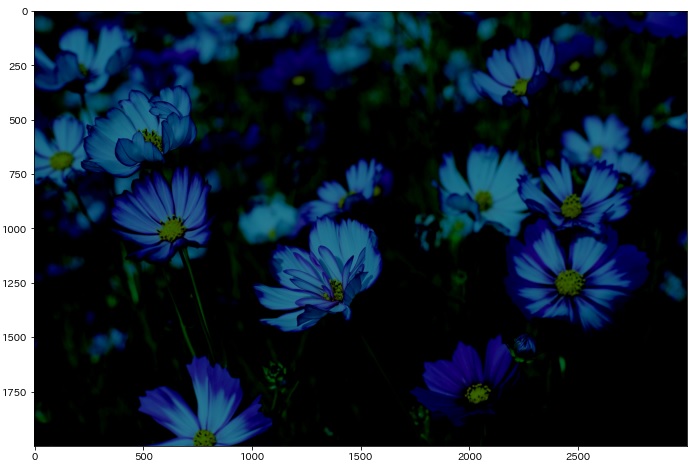
# visualize the result
plt.figure(figsize = (12, 8))
plt.imshow(img_1)
plt.show()The result is like this.
Finally, change the blackened areas to white and the others to the original color.
# change the dark area to white, while keeping the bright area to the original color
for y in range(height):
for x in range(width):
r, g, b = img_0.getpixel((x, y))
r2, g2, b2 = img_1.getpixel((x, y))
if r2 <= 5 and g2 <= 5 and b2 <= 5:
img_1.putpixel((x, y), (255, 255, 255)) # change the dark area to white
else:
img_1.putpixel((x, y), (r, g, b)) # change the bright area to the original color
# show the original and the finalized image
fig = plt.figure(figsize = (15, 8))
ax1 = fig.add_subplot(1, 2, 1)
ax2 = fig.add_subplot(1, 2, 2)
ax1.imshow(img_0)
ax2.imshow(img_1)
ax1.set_title('Original')
ax2.set_title('Selected image area')
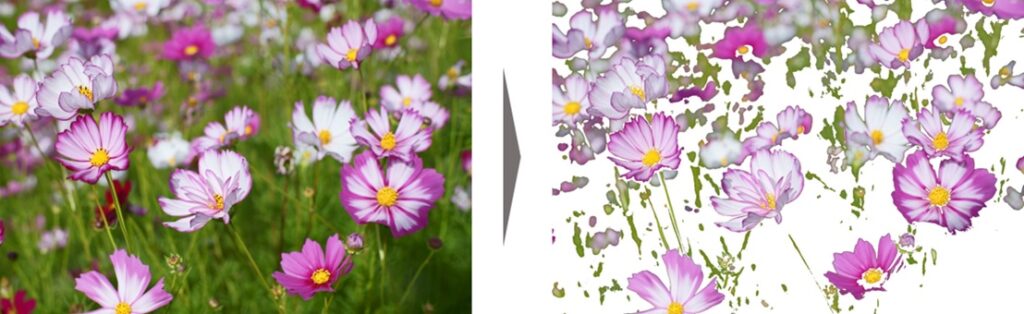
plt.show()Here are the original and the finalized images.
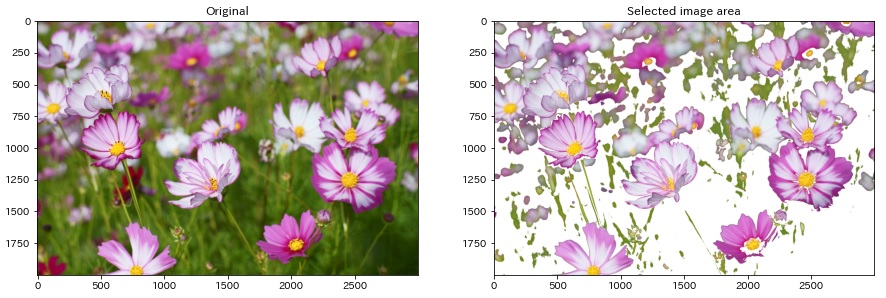
Finally, save the result.
# save the image

img_1.save('result.jpg')
In the next stage, I would like to apply Neural Style Transfer on this image using with a watercolor painting.
The code is downloadable from the link below as a jupyter notebook format. Even if you like it, use at your own risk.
One thought on “Image area selection by intensity (code included)”
Comments are closed.